Too many companies approach engineering tolerances as black and white, all-or-nothing mindset. Dimensions are within tolerance and deemed good or out of tolerance and unacceptable. Things are more complicated than that.
First and foremost all processes have variations. Variations are natural and normal. The two most important questions are:
1- Is your process under control?
2- Is your process capable?
Is your process under control?
A process is under control when its variability is the results of a multitude of small random causes also called common causes. By their own nature these causes cannot be assigned, they come from small changes in the raw material, the settings of the machine, the operator or even external conditions (temperature, humidity, lighting…)
A process which is subject to a special cause will behave erratically and is considered out-of-control. Special causes can be traced back to at least one event which is why we also call them assignable causes.
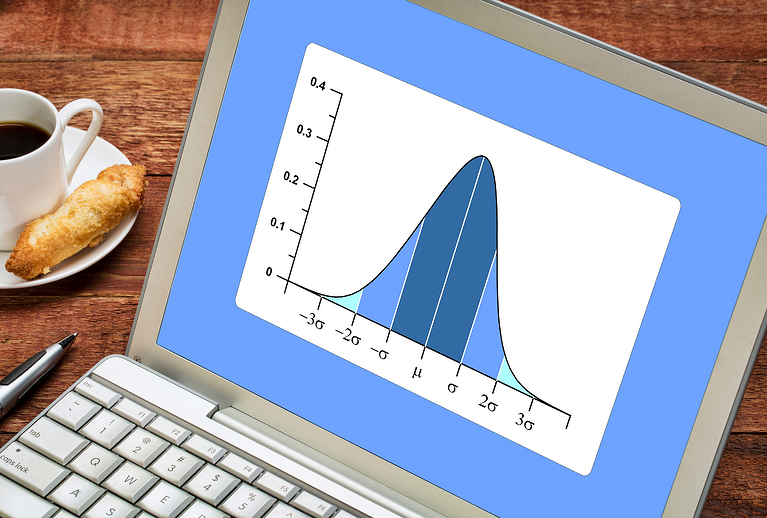
In order to determine whether your process is under control, engineers typically conduct a capability study by measuring a set of products (at least 30) and using statistical tools to analyze the data. As indicated earlier a process which is influenced by common causes will present what is called a normal distribution. The standard deviation characterizes the width of the distribution.
The technique to monitor your process and assure that it stays under control consists of collecting data periodically and reporting them on a statistical chart. It is recommended to have the machine operator collect a few products on a regular basis (commonly five parts every hour) and plot the data points on a statistical chart. The chart shows upper and lower control limits. When values are outside the control limits the process is not stable and the operator stops production
Is your process capable to meet the customer requirements?
Analyzing and monitoring process variations and declaring your process in control and stable is independent from meeting the customer specs. Here comes the notion of capability.
Once you know the variability of a process (i.e. standard deviation) then you can compare it to the customer tolerances and determine whether your process is capable of meeting the customer requirements. It is not a binary pass/fail indicator (i.e. capable/not capable) but it is an index that defines the ability of a process to produce a product that meets the customer specs. Today’s customers expect the manufacturer to know how good they are to comply with their requirements, to develop a plan to improve and to monitor and share the results.
Cp is the index that measures the process-variation range to the specification range while Cpk accounts for process centering.
Centering a process is much different than reducing variation, most of the time it involves tool adjustment or machine settings.
Example
Let’s consider that your office’s regular business hours start at 8AM. The door opens at 7:50AM and your boss is giving you a 10 min grace period, hence we can say that your boss’s expectation is that you start work at 8AM +/- 10 minutes.
Now let’s assume that it takes you on average 30min to go to work. Over a period of 30 days you are tracking the duration of your commute and the results are between 25 and 35 min (i.e. 30 min +/- 5min). If you compare the +/- 10min provided by your company and the actual +/-5min variation in your commute time, the conclusion is that you are highly capable to meet your boss’s expectations (i.e. Cp > 1.66).
It does not mean that you will never be late as your trip to work may be disrupted by a special cause (e.g. traffic jam, school bus, construction works) and by their own natures these are hard to predict or control.
Now if you leave home at 7:50m and regardless of the +/- 5min fluctuation in your commute time you will not make it on time. This is an example of a non centered distribution. The remedy is to leave earlier without changing anything to the method of transportation.
In the second part of this blog post we will look at how Central Midori is using statistical tools.